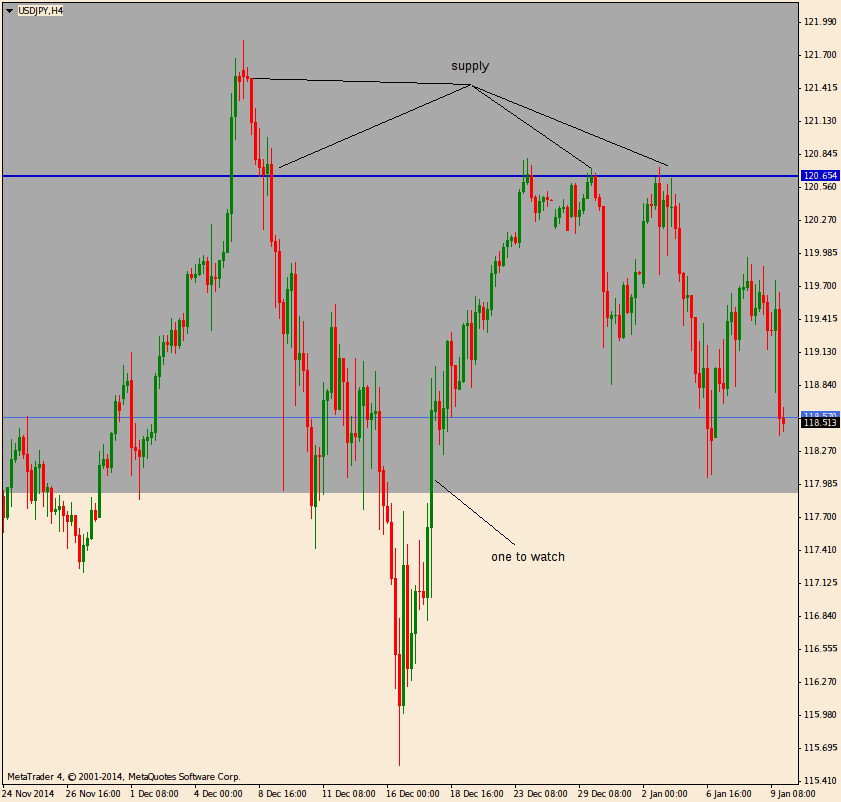
A few emails lately came to me on price action within areas of interest and the approach price makes to those areas. In an attempt to answer this I will use a current price setup and show one of the ways pro money tried in and around these areas. It is important to note that there is no single method used by pro money and learning price action patterns and candle names etc will do you no good. Time and price tells the story and it is not to be treated as a technical or scientific method that you can prove 100% each time.
The point of this post is to have you open your mind about what has happened in the past and if we now see things that are setting up for a reaction in the same direction as history has shown us. The price you see on higher time frame charts are littered with pending and market orders in both directions, but pro money will hide ther intentions for as long as possible and can both time and money on their side.
They can either slowly or quickly push price into an area of interest, they can slowly or quickly push price away from that area, or they can push price through it in a false move, or keep it moving in that new chosen direction.
Another trick is to set price moving in a range. These range plays are dangerous places to enter and the longer price spends inside the range, the more spectacular the move out will be and will also move a long way.
Keep in mind that higher time frames turns tend to happen with the effort to turn price hidden in news releases. Bad news gets price to come down, but if price is already moving down the news does nothing only get price to its ultimate target faster that it would have otherwise. If price is approaching historic demand and the news is bad, the pro's will use this as a mechanism to buy into the selling from the herd, its a cheap and fast way to get lots of orders filled.
If price is moving up and price is already close enough to historic supply, the good news will get more retail traders long and give pro money plenty scope to sell into this news and fill lots of orders at a low price for their entries. What you should never do is expect good news or bad news to move the markets in the direction you think they will. Good news is an aid for selling and bad news is an aid to buying, typically.
If you look back through old price charts around times of major news releases, you will find many times the market had setup to move in that direction already. The news was simply a catalyst to the move.
Look at the Japanese Tsunami, a major bad news story and price fell. You may say of course it will be bad for the Yen and it had to fall. Sure, now looked where it stopped and reversed on a dime....thats pro money at work.
Rewiring your brain to where you can see what is at hand will be tough for a lot of you. It will be hard to buy when prices are falling and there is no sign of recovery i.e confirmation. It will be hard for you to sell when prices are reaching for the moon with no end in sight. These are the highly emotional price moves that pro money know will get you in at the worst time for you, and the cheapest prices for them. They can afford to allow the market go against them for some price range before they will finally cause price to turn.
None of you (or myself) have pockets deep enough to turn price and what we do is wait for the last signs of buying or selling before we enter. Apply logic to what you see on the chart.
If for example you see the market wants to turn from bullish to bearish, what would have to happen?
The logical thing is that buying must dry up, another logical thing is sellers must come into the market, logic again says we should test to see if there are any buyers left. How do we do that?....simple, stop your selling and see will any buyers step in and take prices higher, if prices move higher it means there are buyers still willing to take it and you do not yet have the cheapest price and easiest means to push price lower, if you do all it does is cost you more money than needs be.
This testing and retesting happens all the time on all time frames and all instruments traded. You wont find it mentioned in books because the authors of those books want you to get in on some price formation or pattern. A break of a head and shoulders etc. All that does is get you in long after the main move has happened. As for indicators, do yourself a favor and remove ALL of them because all are a twisted view of old price. They are not showing reality.
The tricks that will destroy your price reading for some time, will be the false moves. These will tug at your emotions and think an old area of supply has just been broken and will now become support and aid price to move up and now that you spotted this, you will go long early and catch the move. No!
You want to see sustained buying and little selling if its a true change in direction. Letting it go for a later test of that area is a safer option. It will prove who the major players are i.e bulls or bears and then on the later test you have a much safer and higher probability entry. This retest can be hours later, but thats fine, we can wait knowing we did not take a bad trade and want a low cost enter with low potential cost stop.
On the Euro/Yen pair there was a few hundred points in a days trading if you applied this logic. The pro's do the same kind of analysis and guessing, its constant testing, false moves etc just to see who is active in the market and what direction they want to go and with what amount of effort (money) behind them.
Perhaps an example of a frozen lake may help. If the weather has been very cold for a few days, the edges of the lake will freeze up first. You test the edge with your foot to see will it hold, you know the potential for the ice to give will be great and you wont place all your weight on the ice, just a gentle push. If it gives way you know there is no point in trying to do the same thing further in. This is the same as price, if you are testing for a direction you can see as potential, you want to see are there others doing the same as you, or others who are the polar opposite.
Lets say the ice is strong, you gain confidence and you place one foot on the ice and give a little down ward stab, the ice still holds, great you say. I will wait a little and try both feet only a few inches in from the edge, knowing that if I go through I wont come to any harm other than two wet feet.
You try both feet, and it holds. You jump up and down, it holds. Now you know the potential for the ice to have some thickness to it further out is now great. And you gradually work your way out. Eventually you see there are no more weak points and you happily get on with your ice skating/fishing etc.
The markets are the same, you watch for the pro's doing these tests and also the false moves which in themselves are nothing more than a test of a different type.
When price enters a range, these are the places where its best to ignore all tests and false moves and wait for price to break out and then test as it comes back close to the range. If it doesnt go back into the range there is a good chance we will see continuation.
Here is the monthly chart show price hitting and breaking supply to the left. The black line shows the price after it broke supply. Do you see strength in the price after it broke through?....all I see are a lot of attempts to push higher, and all failing. This can only mean one thing, there are not enough buyers at these prices, it is not worth placing money into a long position.
Look at A. This is the bearish candle where the true intention of pro money came in for us to see. We know that the move was strong, within one time frame and there will be some residue from that move. The candle close has also shown to setup a support and resistance area. We dont know this until price revisits the area. A few hints of this will be visible on lower time frames, but as always we start on the high time frames to see the ten mile view.
We can see price coming back into the S/R area and rapidly moves away. This is selling by pro money in very very large lots. Forget what you hear about price rejecting and area, this is complete nonsense. Price doesnt reject or accept anything, it is driven by order flow and that move seen on the chart is a sign of overwhelming supply, it rapidly gets orders filled and price has to move away quickly. There is nothing to reject, it is classic selling on a mass scale within a tiny amount of time at the price area. If more folks understood what order flow was, none of these useless words would be thrown about.
Here is the weekly chart.
As time unfolds lower down, we get more information. The B on top is supply and the move away shows a lot of selling also in a short amount of time. There can be no argument about who is in control. I have marked the origin of a push up on the left and its test to the right. Price action between both points is not selling on this time frame, it is just a long pull back and allows the pro's to reload for the final push in the overall move up into supply. The last push tends to be dramatic and very long and strong bullish candles get the herd buying like crazy. This is the ideal time to get such a move because all the long orders play into the hands of the pro's who know there is a very good selling opportunity coming soon and they can hide a lot of their short orders by selling to the herd, who are buying everything they can. Its lambs to the slaughter, but do you think you could not buy when you see this happening on a time frame more suited to day trading?.....probably not because price looks strong, great moves for a few weeks and your making a ton of money, they you see what looks like a pull back and all you do is wait for it to come down more, load up more for the continued move up and your all set.
First of all, look at what I called the last pull back, note the candles, all except one are bearish, look at the time taken, its a rapid move down. Look at what it broke, it has broken the test candle. You could be surprised how many people get taken by this, and even if this were a 5min chart, people will still stay in thinking its nothing more than a pull back.
Daily chart.
B still on top and shows where the sellers came into the market with great force. You can also see two attempts by the untrained to hold the market, there are two minor pull backs, and even if you were long here, if one pull back failed why stay in for that to be broken?
On the bottom blue line is our test candle, which was a test of the previous move up allowing the pro's to get that emotional bullish move going. I bet the news on TV was good and the stories telling us great things.
Price even here has had little in its way to break the test candle, which is also support. And as you know, once support is broken it then sets up to become resistance when price comes back.
4hr chart.
Closer in again and a better look at price falling down into support. The little bounce off was not unexpected and the nice slow move up into the most near term supply gave enough low cost short orders for the bears to finally push price hard down through support. Plenty down side to follow and more yet once we see price come back up to allow the move continue.
A minor test of the break did happen and two candle show where it formed. We were getting close to end of the day/week and plenty profit taking tends to make price action look a little messy then. But the overall picture is pretty as it gets.
Here is a 5min line chart. I put this up just to help show you what real price movement vs pull back looks like, and in time you will see this on a candle stick chart in real time.
As price falls from the left of the chart, it stops and reverse quickly, they slowly winds its want up into the small horizontal black line. The black line is?......near term supply, look left and where the fall originated from and there is one target. We now were so close to the market closing that the subsequent moves wont be as clean, but there was some continuation down after supply was hit and given little in the way of buyers lurk below, we can see more shorting coming in next week.
For comparison here is a candle stick chart of the same 5min period. Where you see price wind itself up into supply, it also helps price fall later because most of the buyers will be gone and little to stop price falling.
If you have the patience to wait, or can develop it, you will do yourself a big favor and loose a lot less. Do not chase price, let it come back to where you want to get in and for a lower price in the overall move. If you time your entries with the 4hr and higher time frames, your chances of success go up by a great margin. Also take note of when pull backs or tests break previous established price areas of interest, if they are broken you are getting a heads up and pay close attention to what is coming.
You can take any time frame and you will see testing testing and pull backs happening in any active market. Remember that there must be active players in the market and the price movement and time taken both show you that. If you have access to volume from the futures markets it is also valuable intel because volume is activity. I dont say much about volume here because forex has tick volume and every broker will have a different volume feed and I wont be able to cover every brokers feed on a chart.
Saturday, 24 January 2015
Sunday, 11 January 2015
usd/jpy
Timely may be the correct word to use and come end of month, it will be shown if what we can see forming will transpire to be the turning point in this pair. Onto the monthly chart.
First thing to note is the current candle on the right edge is not fully formed and closed, it for the moment can only be considered a guide. But looking left of that candle shows us a bullish candle closing off its highs and in an area where there has been historic supply, and given the supply happend many years ago, there is a stronger suggestion that it may be a good place for pro money to consider selling once again. There is still upside potential and this has to be kept in mind until such time as all supply as been eliminated, as yet we are early to this party.
The small black horizontal line is where there was a break/test for a continuation of an upward move and was also ideally placed because we can see the area prior to that test was where pro money accumulated more long orders.
The weekly chart.
I have left the box on top to show were supply was present in the past and also the black horizontal line. One addition is the candle I have marked which is showing where pro money took price low in order to assist them to unwind positions but still maintain some upward momentum. I say unwind because on this time frame to my eye, it looks like the tide is starting to turn. This wont happen over night and so funny business is always going to happen before the weak hands are dealt a blow to their pocket.
Always ask, if we are in a strong trend how could there be such a large spike down. There has to be a reason for this and is strong historic supply enough of a reason, or are they loading up to push higher?....which would you favor?
The daily chart.
Now we see a different situation unfolding. The box for supply still present, as is the black horizontal line showing where price went and reacted off. The rapid turn back up shows still buyers willing to take it higher, but it failed to push above the most previous high, this is no longer a strong bullish move.
Where the black line is drawn I have marked a final push candle. It looks like a bearish candle with a long tail showing buying. It also has considerable volume when viewed on a futures chart. A little before this I have marked a candle entitled emotional push. Such strong candles are never good in a bullish or bearish market and are designed to tug at the retailers emotions and get them into the market now, or risk missing on the big move. The truth is the move is nearing an end and this is how money changes hands and direction in the greater scheme of things. The pull back into the horizontal line tells me that such a move is nothing more than a test to see if more buyers will step in and try for another leg up. This so far has failed to materialise.
4hr chart.
Now we are getting close to the coal face. I marked where supply is coming in and also marked a blue line showing how it looks when viewed as an area. There is nothing on this time frame that shows continued bullish activity. But, and there is always a but. The bottom of the box has another candle I marked that is part of a wide range to be wary of. Some of the buyers in the candle have been taken out, yet others will still be present waiting. If too many buyers are still present as price falls, there may be the formation of a new range. It is a popular tactic to fake out, tire out and finally take out all those who who try to out smart pro money. If you are already in the right direction chosen by pro money, they will do the best to get you out with false moves, taking a long time to make the move, in hopes to get you out from boredom and you close your position, or they will kick off a false move to take you out. Which ever mechanism is used, you can either hold long term with a sensible stop, or else you are adding to their low cost entries.
Same holds true for pull backs, the deeper the pull back gets or the longer it continues, the more orders pro money can filter in.
1hr chart.
Overall we are in a bullish move, yet take note of the ease at which price can fall. The reaction from the bulls is pretty much mute and any reaction they do have, is slow and sluggish.
The same 1hr chart shown as a line.
Perhaps the move down being faster than anything the bulls can muster is easier to see.
Last up is the 5min chart and zoomed in a little.
In the middle of the chart is price pushing up into supply, this is no different to the previous charts where I also showed an emotional push candle that has the same effect on a different time frame. The reaction to all this mega buying is......a market turn. If you look at any time frame in isolation you will not see this move down was probable. Now that you can see it was probable and missed the first move down, where would subsequent entries make sense?
Well, how about at the break/test/continuation areas?
It tells more than just an entry, it tells us where have the bulls gone if they had some much force to push the market up that fast. The entire move up and its origin was nothing more than a false move designed to get folks long. Getting the retail trader long means low cost short entries for pro money and this happens on every time frame, every financial instrument since trading began.
Price rarely rise or falls immediately on the first break from the previous direction, the secondard test on higher time frames is where a lot of the main move is built from and its something to watch out for carefully. It is also the safest place to enter with a low risk. All you need to is develop the patience to wait for the price to pull back after a high time frame has unwound.
Put in the time to mark all your 4hr+ time frames for historic supply and demand and you will do yourself a great favour. As price changes direction eventually in one of those supply and demand areas you have to pay attention to how price action looks and where the opposing forces are gaining ground. At the supply areas you need to look for signs of distribution where the longs are getting out and where early signs of supply show up. On the bearish side where shorts are getting out, the instrument will be bought into and the same type of testing to see will areas hold and no further sellers available in great numbers, which no makes it easy/low cost for pro money to reverse the market.
By low cost/cheap, I of course mean cheaper. It is never cheap to turn any market and fractions of a penny in large enough volumes add up to significant investment.
It is a pointless activity and a waste of your time to look for certain candle formations, all it does is fill your head with useless information and take you away from what you should be doing, which is watch price move and how candles form. Pro money are not silly enough to push price to where it will form predictable candle patterns each time. That would defeat their agenda which is to either get you out of the market or get in well ahead before you notice. As I mentioned before, they will fake you out, stop you out or tire you out. Either one works and is proven to work for a long long time.
Thursday, 25 December 2014
Seasons greetings
Hope you all have a great Christmas and a relaxing time to recharge before the daily routine kicks in again.
More charts to come over the next few days and excuse any typo's, I have the feeling some posts may be sponsored by B&W (Brandy and Whiskey).
Doc
More charts to come over the next few days and excuse any typo's, I have the feeling some posts may be sponsored by B&W (Brandy and Whiskey).
Doc
Sunday, 21 December 2014
Pro money actions
This is a tough post to put words to. Pro money activity is not a single candle or formation that happens, it is a combination of time, price, reaction to their efforts and how easy or difficult it is for them to slow and finally turn a trend or range in progress. It is expensive for pro money to do this work and it has to be done in places where it will the best opportunity to work and not have to do it again at a later time. Too much effort with little result means a range is likely to form and then its a game of who has the deepest pockets. Ranges are very expensive to break and he who has the most cash wins. This is why I tell you to wait for a break and test of the break to see will it hold. Let the pro's do their thing and be happy in that you can see what has happened and can react accordingly.
Here are a few charts of the Eur/Usd and a break down of one approach used by pro money. There is little point in learning the pattern or naming anything other than the most basic parts there are in this, because all it will achieve is you filling your brain with useless words and terms and not concentrating on how price looks. Once you have at least one good eye, all you need to do is watch price form and close. I say form, because you want to see where the action took place as a candle formed, this can be useful intel especially around price areas of interest to pro money.
There will be plenty emotional tugs in your mind as to why you must trade in the direction of the candles because they just look so good and strong and are moving with great progress. This is nothing more than a sucker punch and you are falling into their trap. It is very hard to show anyone why not consider going opposite to the main move when it is so obvious to them that thats not where price is going. Breaking these emotional ties will be difficult and takes a long time. If something looks too good to be true, and even if you are in this money making move, you will have so much confidence that nobody can talk you out of taking profit or closing the position completely in readiness for the turn.
If I had a penny for each time someone wanted just 10 more points, or I know it will turn around now, or it looks weak/strong etc, I could give up work and retire. Be ruthless with your entry, stop and target because without knowing all three before you enter the market, you are on the poor man's slide to becoming broke and throwing money away. All three functions must be plotted either on the chart or in your mind before you enter and DO NOT change them. You must know what is the most money I am prepared to loose before I take a new trade. This is basic money management and it must be a realistic figure. Wealth is not created in a few trades, but over a longer period of time where smaller bites are taken out of the market and not look for big moves. Take small profits all the time and take small losses a lesser amount of time. Then your account grows and given enough experience and confidence you can then slowly places slightly higher value trades in the market, this gets extra profits for the same point risk and target as you will have always done. But dont jump into increasing trade size until such time as your account can take it.
I could write volumes on taking care of your capital, but let the most basic things be your guide, protect your capital and it allows you come back to trade again tomorrow. But loose it and you can no longer trade.
Moving on to some charts.
4hr chart of the Euro and I have drawn in a box on top showing historic supply. We know sellers were active here in the past and that the area has been untouch for a long time relative to this time frame. We know any new entry into this price area is likely to see some sellers come back in and we watch for signs of the bullish move showing signs of weakness.
The big sign in this chart is the single long bullish candle with a spike on top. This is printed as a bullish candle, but is in reality bearish. We this from the reaction to it in the next closed candle. If such a powerful bullish candle resulted in the next candle being strongly bearish, then how can the up move continue. Could it be the orders up in the box be some over whelming that the buying was really an attempt by pro money to show the retail trader that the price is really heading for the moon and its been like this for the past half days trading session and you are missing out unless you go long right now!
Sure, its the ulitmate sucker punch that happens on all financial instruments and on all time frames. But they happen much nicer on the 4hr and daily. Which is why I take most of my trade leads from the 4hr and daily time frames.
1hr chart.
A little closer in on price action here, count 4 candles back, but start from the candle with the spike. This is how the 4 hr candle looked as it was forming. Can you now see how the strength of the buying started to slow down towards the end of its life?
This folks is the basis of price action, it is often reported as closed candles only, but its also important to look for how it behaved as it was forming. Become fully informed and get as much intel as you can in these important areas.
15min chart.
Here is the first real clear sign of the bullish move in trouble. Again look at the candles from the spike back left to where the large bearish candle held price down for one time period. That puch back up to the spike was nothing other than the tugs on the retail traders emtions to get in now before you miss the rocket take off. The candles rarely form the same pattern time after time inside these boxes. You must look at them in context with the other candles around it and not try and fit them into a pattern, but allow the newly formed pattern make sense to your logical brain. Ask yourself some fundamental questions, who would be buying up here, who would be selling up here. If I bought up here, who am I buying from?....if I am selling here, who I am selling to?
Your customer must always be, the retail trader. And I guess there are folks here who have been my customers. But unlike the faceless institutions who just take your money, I tell you how this works. There is a lot of work for you to do in learning to be patient and getting an entry after you have seen the evidence of pro money at work. There tends to be a second shot where the more careful traders step in and place their orders. It wont happen all the time and its important you not be hard on yourself for missing what was a perfect trade. Unless I see the right entry after a good setup, I let it go and wait for another. In time this will save you money and help you grow an account rather than pull the trigger on any entry after a good setup. Quality rather than quantity is the message.
Down to the 5min and this time frame and sometimes the 1min is where I take my entry lead from after all the higher time frames are shown good intel. I have zoomed in closer to price action so that I can explain this clearer than the regular chart view.
The brown box is of course the bow from the 4hr chart and I have to make this clear because there are emails asking me at times why some of my chart have two background colours.
We still start with the highest candle that looked not too unlike this on the 4hr chart. There is still a large wick and a bearish reaction. The bearish reaction is not as impressive as the 4hr, but it does still tell us a story. There are tails on the tow candles after the climatic bullish candle and there were some buyers remaining who were most likely have been the retail trader cannon fodder types. The large bearish candle is an important placement because it showed up in a place where only buying within a pull back would have otherwise taken place.
A small bullish move up over the next three candles happened with signs of selling coming in as price rose higher. Again, any bullish continuation would not have shown this. There are also two tests on bullish candles which are checking for remaining buyers. Each test resulted in lower prices and helps solidify pro moneys investment in more down side. They wont jump in right away and slowly unwind one position and sell into remaining buying. This is will different each time which is why looking for patterns wont be as productive as you analytical and logical brain can be.
Note the bottom of the brown box, it has setup into a resistance area. This wont always happen but in this instance it shows up the willingness for pro money to effectively put a cap on price and do not want to see higher prices.
A second 5min chart. I have drawn in a yellow line to show what was and what will further be shown as another area where price has reacted in the past.
Here is another 4hr chart zoomed out and showing the same yellow line as the above 5min chart.
In this chart we can see way back left where this area was important and if you look for long enough on high time frames you will see there are a few of these on other price areas. Make yourself aware of them.
Towards the upper right of the box you will see another spike into the box drawn in all of the charts. Take note of the similar approach used by pro money, highly emotive push for price to reach the moon and if you are not in, you will miss a big move.
Also note the reaction was different to the last, even though the push is the same. This is why I say to not learn patterns just for the sake of knowing patterns.
I hope this helps some of you and that something does go click in your head. Lots more can be written on this, but for the moment there should be plenty in that to feed your brain. Take some time now and apply this to other pairs from high time frames all the way down to the 5min.
Saturday, 20 December 2014
Eur/Usd
A quick look at the Euro/Usd before the Christmas week crazy trading kicks in, this is the time of year when price action wont be as useful as it would otherwise and the end of year is also a time when many positions for those in the pro money world who trade longer time frames.
This is my ten mile high view. Look for the obvious and proven price history, ignore the current candle because it is not yet closed and of no value to us. We see where price has been and how it reacted. The short story is, price has come from a higher price to a lower price and with good pace and little to hinder it. This tells us the bears are in full control and there are no signs of this changing on this time frame yet. If there is no sign change, or no sign of change, then we continue with a bearish view until price proves otherwise.
Another monthly chart with one important addition. A yellow line to show support and resistance. This is an approximate area and not a single line/pixel or 1 thou tolerance line. It is an area.
We need to know ahead of time where price can potentially react, we need this for entries, exits and stops. All are of equal importance in trading. On the next chart we will look a little closer and get more intel.
Weekly chart.
Not much different you say, close but look again. The yellow line now has a corrected value to 1.20000. This is a price area that many will look for a bounce, if enough traders share the same view, then there will be a bounce because it becomes self full filling. Plus there are strong technical reasons for a bounce there, we see historic buying to the left of price in May 2012. When old and clean price areas like that are untouched for a long period of time, then can show violent reactions and price takes off quickly. If this happens, you may not see a pull back until price has gone some distance. But if price stays in the area for a longer period of time, it means there are less interested buyers. That would not be good for the Euro, because any drop through 1.20000 will be hard to contain. If it did happen, I would expect the ECB to announce some major purchase of bonds etc to happen quickly. This is nothing more than a money game to see who can do the least and spend the least to make the most amount of money, that is from a Gov perspective. Any Gov react to the markets rather than stop them falling, they are always last to the party.
Daily chart.
I marked what looks like messy price action to show the bears are still in control. The retraces are chaotic, yet still comply with standard supply and demand groups. Note how price is slowing down as it gets closer to the major area of buying back in 2012. Pro money has to unload as price falls and buy in before it hits what eventually becomes the bottom. Otherwise a single close and open of new positions would create such spikes that it would be near impossible for anyone to gain a good entry and hold onto it. The last few days show a strong push down and given the time of year it is, this may be nothing more than positions being liquidated and willing sellers taking the orders for a quick trip down for equally quick profit into a safe area.
Price has closed lower and shows a strong close with no buyers or signs of a pull back on this time frame.
Lastly the 4hr chart.
I have placed some white lines showing the retraces and the boxes where the bears took over again. It does look more and more messy the lower you get in time, but its still perfect supply and demand trading. Wider stops than normal were needed inside all this mess in order to pull out a few winning trades.
On the last two candles there is some buying, not much and still closed below the previous bottom. The closer we get to 1.20000 the more risk you take on when shorting.
There are other pairs who are also coming close to major potential turning points and it is no fluke that this happens in or around the same time. For the past 100 years the markets have behaved like this and will still be behave the same in the next 100. You or I wont change them one single bit with our tiny influence.
I did get an email requesting to show on a chart where pro money comes in. Looking at the chart below I will give you a hint, look for the box and then look for the reaction. The reaction is the result of pro money, but they hide most of their tracks inside the box. On lower time frames there is more intel on what it looks like and will look very much the same, you are safer to trade the retest of the pro money result than the initial break. Any strong break will have a test and continuation, most of the time. But trading a break is a lower pay out and higher stop hit count.
Oil
It wont come as any surprise that Oil has been on the slippery slope to lower prices and it may be beneficial now to take a look at where this began and where it could go.
My chart history wont go back far enough to show you the big picture, so I have borrowed a chart from the Nasdaq website to aid this post. If anyone from the Nasdaq are unhappy over the use of your public chart and request I remove it, I shall do so.
Here is the Nasdaq 10 year chart on Crude Oil.
The media has been full of experts saying they will see 40 dollar prices. It does not take an expert to pull that figure out of the air when you look at historic prices.The business TV news and various financial web sites who pimp this news provide me with hours of entertainment, the best comedy shows I have ever seen.
Clearly there was a 2009 major buying in Oil at the 40 dollar price area. It is inevitable we see some reaction there again. Low Oil prices have two wanted effects, one is from Opec and the other is from Governments who wish to punish a large energy exporting country.
Here is the weekly chart, all you see is Oil falling of a cliff and one tiny blue candle formed in the perfect place to test the resolve of buyers. Clearly other plans were afoot and down it goes.
The tiny candle is now a support and resistance area and is likely to be a strong one too when price eventually comes back to it.
Daily chart. The newly formed support and resistance area is now marked with a line to help guide your eye. Note the strong break of this and the very painful retest which look like buyers. Indeed there were buyers and I will let you think who was behind that. A hint could be a non english speaking nation.
Clearly damage limitation was in full swing, but when the worlds finance houses are against, nothing will save your behind. On the futures charts I saw a huge volume spike on that candle, and was sustained for the day. Thats not the typical pull back I would expect to see.
On the bottom right of the chart there is new price action showing a slow down. A battle took place between the bulls and the bears and is not yet resolved. We will delve in deeper in the next time frame lower.
4hr chart.
The support and resistance area is now more clearly defined and once broken, price did not look back until a long fall in price took place. What looked like buying in the above chart is also more clearly defined in this time frame. What we see is buying over 3 x 4hr periods and into near term supply, which clearly held. None of this comes as a surprise given the news driven frenzy at this point.
At the origin of this supply test I have a white line showing the next area price has to test for remaining buyers. Price pushed through the line hard on the way down and when it retracted we see a number of candles with wicks on top. This shows us sellers came back in and around those higher prices where the near term selling originated.
The initial fall from the S/R line was too fast to keep going and some slow down and pull back for a good percentage of the move was inevitable. On the right of the chart we see the start of this happening. There is no major floor for buying with a view to turning the market bullish again. Above price there are a few places where the continuation could happen. Of course you also have to keep in mind the tricks of pro money. If everyone is expecting 40 dollars a barrel for Oil, if the price keeps retracting some will think the buyers have come in early. This can happen for weeks, or a wide range setup. Looking at price action at each of the potential continuation areas above is key to you getting a feel for how pro money are positioning.
1hr chart.
I mentioned a price range in the above text and now I will show you one potential range. This 1hr time frame has set into a range already and look at the reaction of price at the top of the range vs the bottom of the range.
It is obvious there are still more interested sellers than there are buyers. In the past I have said that when price forms a range, it only makes sense to sell of the top of the range and buy off the bottom. But keeping in mind of the overall trend you are in and ideally, buy or sell in line with the overall trend to help reduce risk.
Saturday, 8 November 2014
Entries over view
A number of recent emails requested I show what I look for on the lead up to taking a trade. So without further delay here is what I do from my ten mile high view on the high time frames down to day trading time frames.
The pair has no relevance and it just a means of demonstrating the approach. Some pairs act in ways where they wont provide the same degree of comfort to the trader in how to look and feel. It may sound odd at first, but each pair has a personality in how they behave. A casual glance will show pairs outside of the majors to have a spiky nature or when their price moves, it moves in large swings.
Monthly chart where I start my analysis each month with a look at last months candle close. And you should only ever trade on a candle close and not when it is forming. Otherwise you risk price looking much different to what you think it will be. So trade what you see as fact i.e a closed candle and not trade what you think.
This is the blank chart and from here you can apply what you feel is necessary to help you paint a picture of what has happened over time. My way is not the right way or only way, just one approach that works for me. Add, remove and modify as you see fit because we all think differently, unless you listen to the media and become one of the herd.
I have drawn in a tick mark on top which shows the climatic price action of the market top. On the bottom of the chart is the lowest price within the charts time. The middle line is a support and resistance line, but in reality it is an area as all price can be. Dont look for price to react to the pixel, it is akin chasing rainbows.
So far we know price in the near term has fallen from the high, bounced off the low, hit resistance and bounced back down from the resistance line/area. We therefore deduce that price is still bearish and we want to be on the side of the market favored by the majority.
If we shorted we need to know where is a good place to take profit. We also need to know where is a good place for a stop and of course, where to enter.
Weekly chart.
A little closer into the price action and we now see more detail. It is still too high a time frame for most to trade and we pull what information we can from the chart. We can see price hitting the resistance area and the strong move away. This clearly shows a lot of sellers and as price moves down the pull backs are relatively mild which shows how strong the selling is and the desire to reach a target. A target is a figure of speech and there is no one target, but a price area.
The white line is near term support and resistance and price slowed as it approached this. The warning sign was the large bullish print a little above the white line. The price was reacting to an area of consolidation on the left of the line.
Ignore the approx 100 points label. It should read 1000 points. If you were pro money, would taking price up to where it has just been make more sense and be easier profit than it would to take it lower where price has not been for a long time and where historic orders are likely lower in value?
The daily bread and butter chart. This is the most viewed time frame for most instruments traded. I zoomed out a little to show more of the price move.
The white S/R line is still here for reference so that we know where we are in the bigger picture. Note price falling from the high and there is one place where price accelerated rapidly. Shortly after this price spiked into that area. This was a means of getting a better price for pro money to continue the move down and was aided by the fact that most traders would have been stopped out, others gone long and subsequently stopped out, which all feed pro money easy profit. If you wanted to hold through that spike you would need deep pockets.
Lastly we see price poke below the S/R line and will have been seen as continuation. But taking that as the market was about to close and close into the end of the week would have been unwise. You are better to enter into an active market.
Now we are down to the 4hr time frame. The white S/R line is here again for reference and also is a large box placed into an area where supply (sellers) are active. You can see the large effort to pull more and more short orders in order to get price down. The previously mentioned consolidation was the most likely reason for this price action.
Towards the end of the market you see the false move down and price closing above S/R. This means the time is not yet here for further bearish moves and a retracement is necessary. I highlighted with two white line places where pull backs into look good. There are sellers waiting in there.
The 1hr time frame wont be of much use at the moment because we do not have activity and I only put it on here to show how lower time frames begin to expand what looks cleaner on higher time frames. Note there are now three white lines showing places where sellers are waiting. Anyone one of those could be the point at which the market turns again, but you now know the turns happen in an area rather than a finite price.
The London close showed the most activity for the session and volume on a futures chart showed that play out. The slow drift up in the NY session was a non event and it never gained enough momentum to trade.
When you finally place a trade and we will assume for the moment that you only trade with a standard lot of one point per 10 dollars. Rather than risk the 10 dollars consider scaling in. Break your trade into .2 of a lot. Now your risk is 2 dollars per entry per point. Less to loose is the market turns of spikes etc.
If you got a good entry and price moves as you had watched it unfold, you can now get in again on a low time frame pull back and doing this a few times will get your full single lot trade in the market with a lot lower risk.
You can scale out on the same basis. Set a target on successive further away prices and move your stops accordingly. I will put up another post of realistic places for a day trader to use on the 1, 5 and 15min time frames.
Subscribe to:
Posts (Atom)