The point of this post is to have you open your mind about what has happened in the past and if we now see things that are setting up for a reaction in the same direction as history has shown us. The price you see on higher time frame charts are littered with pending and market orders in both directions, but pro money will hide ther intentions for as long as possible and can both time and money on their side.
They can either slowly or quickly push price into an area of interest, they can slowly or quickly push price away from that area, or they can push price through it in a false move, or keep it moving in that new chosen direction.
Another trick is to set price moving in a range. These range plays are dangerous places to enter and the longer price spends inside the range, the more spectacular the move out will be and will also move a long way.
Keep in mind that higher time frames turns tend to happen with the effort to turn price hidden in news releases. Bad news gets price to come down, but if price is already moving down the news does nothing only get price to its ultimate target faster that it would have otherwise. If price is approaching historic demand and the news is bad, the pro's will use this as a mechanism to buy into the selling from the herd, its a cheap and fast way to get lots of orders filled.
If price is moving up and price is already close enough to historic supply, the good news will get more retail traders long and give pro money plenty scope to sell into this news and fill lots of orders at a low price for their entries. What you should never do is expect good news or bad news to move the markets in the direction you think they will. Good news is an aid for selling and bad news is an aid to buying, typically.
If you look back through old price charts around times of major news releases, you will find many times the market had setup to move in that direction already. The news was simply a catalyst to the move.
Look at the Japanese Tsunami, a major bad news story and price fell. You may say of course it will be bad for the Yen and it had to fall. Sure, now looked where it stopped and reversed on a dime....thats pro money at work.
Rewiring your brain to where you can see what is at hand will be tough for a lot of you. It will be hard to buy when prices are falling and there is no sign of recovery i.e confirmation. It will be hard for you to sell when prices are reaching for the moon with no end in sight. These are the highly emotional price moves that pro money know will get you in at the worst time for you, and the cheapest prices for them. They can afford to allow the market go against them for some price range before they will finally cause price to turn.
None of you (or myself) have pockets deep enough to turn price and what we do is wait for the last signs of buying or selling before we enter. Apply logic to what you see on the chart.
If for example you see the market wants to turn from bullish to bearish, what would have to happen?
The logical thing is that buying must dry up, another logical thing is sellers must come into the market, logic again says we should test to see if there are any buyers left. How do we do that?....simple, stop your selling and see will any buyers step in and take prices higher, if prices move higher it means there are buyers still willing to take it and you do not yet have the cheapest price and easiest means to push price lower, if you do all it does is cost you more money than needs be.
This testing and retesting happens all the time on all time frames and all instruments traded. You wont find it mentioned in books because the authors of those books want you to get in on some price formation or pattern. A break of a head and shoulders etc. All that does is get you in long after the main move has happened. As for indicators, do yourself a favor and remove ALL of them because all are a twisted view of old price. They are not showing reality.
The tricks that will destroy your price reading for some time, will be the false moves. These will tug at your emotions and think an old area of supply has just been broken and will now become support and aid price to move up and now that you spotted this, you will go long early and catch the move. No!
You want to see sustained buying and little selling if its a true change in direction. Letting it go for a later test of that area is a safer option. It will prove who the major players are i.e bulls or bears and then on the later test you have a much safer and higher probability entry. This retest can be hours later, but thats fine, we can wait knowing we did not take a bad trade and want a low cost enter with low potential cost stop.
On the Euro/Yen pair there was a few hundred points in a days trading if you applied this logic. The pro's do the same kind of analysis and guessing, its constant testing, false moves etc just to see who is active in the market and what direction they want to go and with what amount of effort (money) behind them.
Perhaps an example of a frozen lake may help. If the weather has been very cold for a few days, the edges of the lake will freeze up first. You test the edge with your foot to see will it hold, you know the potential for the ice to give will be great and you wont place all your weight on the ice, just a gentle push. If it gives way you know there is no point in trying to do the same thing further in. This is the same as price, if you are testing for a direction you can see as potential, you want to see are there others doing the same as you, or others who are the polar opposite.
Lets say the ice is strong, you gain confidence and you place one foot on the ice and give a little down ward stab, the ice still holds, great you say. I will wait a little and try both feet only a few inches in from the edge, knowing that if I go through I wont come to any harm other than two wet feet.
You try both feet, and it holds. You jump up and down, it holds. Now you know the potential for the ice to have some thickness to it further out is now great. And you gradually work your way out. Eventually you see there are no more weak points and you happily get on with your ice skating/fishing etc.
The markets are the same, you watch for the pro's doing these tests and also the false moves which in themselves are nothing more than a test of a different type.
When price enters a range, these are the places where its best to ignore all tests and false moves and wait for price to break out and then test as it comes back close to the range. If it doesnt go back into the range there is a good chance we will see continuation.
Here is the monthly chart show price hitting and breaking supply to the left. The black line shows the price after it broke supply. Do you see strength in the price after it broke through?....all I see are a lot of attempts to push higher, and all failing. This can only mean one thing, there are not enough buyers at these prices, it is not worth placing money into a long position.
Look at A. This is the bearish candle where the true intention of pro money came in for us to see. We know that the move was strong, within one time frame and there will be some residue from that move. The candle close has also shown to setup a support and resistance area. We dont know this until price revisits the area. A few hints of this will be visible on lower time frames, but as always we start on the high time frames to see the ten mile view.
We can see price coming back into the S/R area and rapidly moves away. This is selling by pro money in very very large lots. Forget what you hear about price rejecting and area, this is complete nonsense. Price doesnt reject or accept anything, it is driven by order flow and that move seen on the chart is a sign of overwhelming supply, it rapidly gets orders filled and price has to move away quickly. There is nothing to reject, it is classic selling on a mass scale within a tiny amount of time at the price area. If more folks understood what order flow was, none of these useless words would be thrown about.

Here is the weekly chart.
As time unfolds lower down, we get more information. The B on top is supply and the move away shows a lot of selling also in a short amount of time. There can be no argument about who is in control. I have marked the origin of a push up on the left and its test to the right. Price action between both points is not selling on this time frame, it is just a long pull back and allows the pro's to reload for the final push in the overall move up into supply. The last push tends to be dramatic and very long and strong bullish candles get the herd buying like crazy. This is the ideal time to get such a move because all the long orders play into the hands of the pro's who know there is a very good selling opportunity coming soon and they can hide a lot of their short orders by selling to the herd, who are buying everything they can. Its lambs to the slaughter, but do you think you could not buy when you see this happening on a time frame more suited to day trading?.....probably not because price looks strong, great moves for a few weeks and your making a ton of money, they you see what looks like a pull back and all you do is wait for it to come down more, load up more for the continued move up and your all set.
First of all, look at what I called the last pull back, note the candles, all except one are bearish, look at the time taken, its a rapid move down. Look at what it broke, it has broken the test candle. You could be surprised how many people get taken by this, and even if this were a 5min chart, people will still stay in thinking its nothing more than a pull back.

Daily chart.
B still on top and shows where the sellers came into the market with great force. You can also see two attempts by the untrained to hold the market, there are two minor pull backs, and even if you were long here, if one pull back failed why stay in for that to be broken?
On the bottom blue line is our test candle, which was a test of the previous move up allowing the pro's to get that emotional bullish move going. I bet the news on TV was good and the stories telling us great things.
Price even here has had little in its way to break the test candle, which is also support. And as you know, once support is broken it then sets up to become resistance when price comes back.

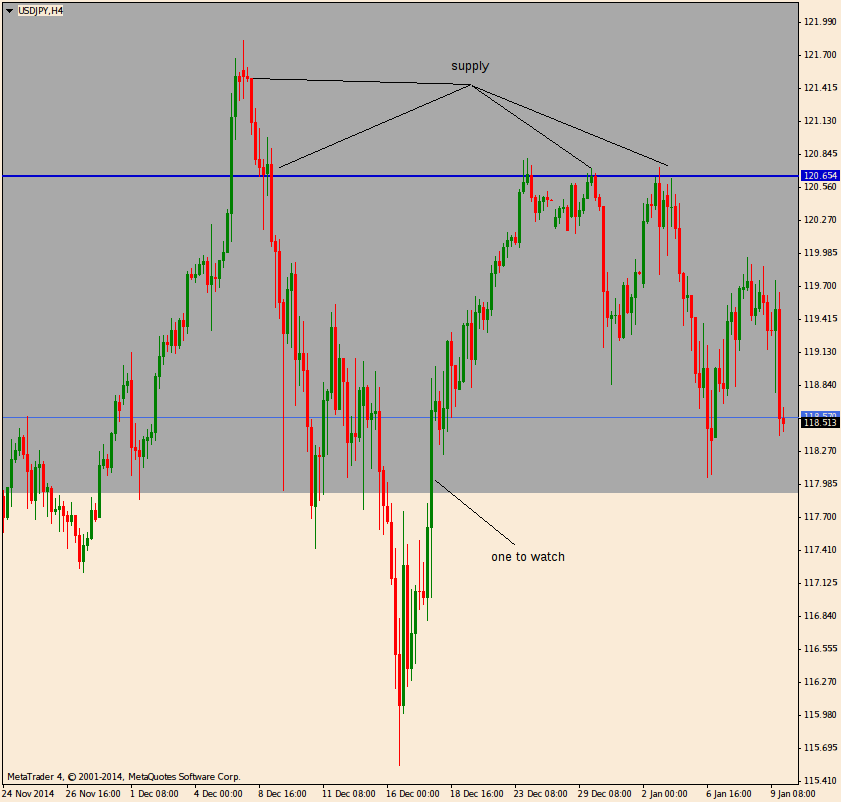
4hr chart.
Closer in again and a better look at price falling down into support. The little bounce off was not unexpected and the nice slow move up into the most near term supply gave enough low cost short orders for the bears to finally push price hard down through support. Plenty down side to follow and more yet once we see price come back up to allow the move continue.
A minor test of the break did happen and two candle show where it formed. We were getting close to end of the day/week and plenty profit taking tends to make price action look a little messy then. But the overall picture is pretty as it gets.

Here is a 5min line chart. I put this up just to help show you what real price movement vs pull back looks like, and in time you will see this on a candle stick chart in real time.
As price falls from the left of the chart, it stops and reverse quickly, they slowly winds its want up into the small horizontal black line. The black line is?......near term supply, look left and where the fall originated from and there is one target. We now were so close to the market closing that the subsequent moves wont be as clean, but there was some continuation down after supply was hit and given little in the way of buyers lurk below, we can see more shorting coming in next week.

For comparison here is a candle stick chart of the same 5min period. Where you see price wind itself up into supply, it also helps price fall later because most of the buyers will be gone and little to stop price falling.

If you have the patience to wait, or can develop it, you will do yourself a big favor and loose a lot less. Do not chase price, let it come back to where you want to get in and for a lower price in the overall move. If you time your entries with the 4hr and higher time frames, your chances of success go up by a great margin. Also take note of when pull backs or tests break previous established price areas of interest, if they are broken you are getting a heads up and pay close attention to what is coming.
You can take any time frame and you will see testing testing and pull backs happening in any active market. Remember that there must be active players in the market and the price movement and time taken both show you that. If you have access to volume from the futures markets it is also valuable intel because volume is activity. I dont say much about volume here because forex has tick volume and every broker will have a different volume feed and I wont be able to cover every brokers feed on a chart.